Online spending was virtually flat in August compared to a year ago, according to Signifyd Pulse ecommerce data, though an examination of spending by category indicates consumers are still spending robustly on needs while showing less enthusiasm for discretionary purchases in the face of easing, but persistent, inflation.
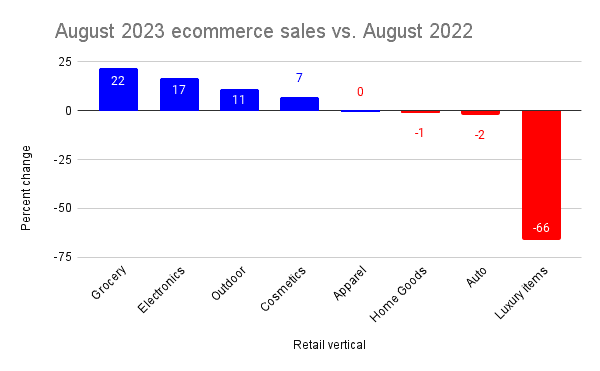
Luxury goods were the biggest loser in August with sales falling 66% compared to August 2022, Signifyd data shows. Meanwhile, spending on groceries led the upside, rising 22% year over year.
The two categories tell the tale of the state of the consumer in August.
The flush feeling fueled by government pandemic relief and limited opportunities to spend on entertainment and travel is fading fast. Savings rates are falling and inflation is wearing consumers down — to the point where they’re ready to sacrifice luxuries in order to accommodate higher food prices. Many have also sated their pent-up demand for post-pandemic travel and nights on the town. And whatever consumers’ appetites for those things, the money just isn’t there anymore. But groceries? Food will be on the table no matter the high prices.
August ecommerce stats show winners and losers
Of course, consumers do not live by food and luxury alone. Spending was strong in the electronics category, up 12%, as many headed back to school or prepared for heading back. The average value of orders was up also — rising 17% and indicating strong demand for big-ticket items like laptops and mobile phones (once considered a luxury, but more of an essential now).
August 2023 ecommerce sales vs. August 2022 |
| Retail vertical | Percent change |
| Grocery | +22% |
| Electronics | +17% |
| Outdoor & leisure | +11% |
| Beauty & cosmetics | +7% |
| Fashion & apparel | 0% |
| Home goods | -1% |
| Luxury items | -66% |
Outdoor goods and cosmetics have a good month, ecommerce data shows
Other winning key categories in August included leisure and outdoor, up 11% year over year and beauty and cosmetics, up 7%. The fashion and apparel category, meanwhile, matched ecommerce performance overall, with spending holding steady compared to August 2022.
Signifyd’s Ecommerce Pulse numbers are based on transactional and behavioral intelligence produced by the company’s Commerce Network of thousands of brands around the world. This story compares sales in August 2023 to same-store sales in August 2022.
Online retail statistics indicate that home goods cooled off
But of course, if overall online spending was flat, some verticals pulled down the average. Home goods hit the skids in August, dropping 1% over a year ago. This after being a spending superstar during the pandemic and coming off of two consecutive months of year-over-year increases. The truth is consumers can only remodel rooms so many times and they only need so many couches. Big box home good stores are reporting that shoppers are trading in major projects for far-less-expensive DIY weekend tasks.

While overall ecommerce sales didn’t budge in August compared to a year ago, the value of each online order rose by 4%, while the number of items in each order increased by 13%. So, consumers were shopping less often, buying more things per shopping trip and spending the same amount of money overall. That’s the profile of a shopper who is trading down to offset higher prices — buying from less expensive brands or settling for cheaper models of products or buying smaller sizes or quantities of some goods. Or maybe a consumer who is doing all — or any number of — those things.
Consumers adjusting to high prices and low bank accounts
The trends reflect a change in consumer online behavior that Signifyd Chief Customer Officer J. Bennett described during the recording of an upcoming episode of Signifyd’s Fearless Commerce podcast.
“I’d say the biggest thing to these consumers is price,” Bennett said. “Price as it relates to value. If prices are fluctuating, which they are, if people are going online and trying to save money again, that is a very different kind of purchasing behavior than, ‘I have to get this thing, so I am going to go find it and buy it.’”
The trend is hardly a surprise, given what consumers have been telling us. In a recent Signifyd consumer survey, 80% of those polled said inflation had caused them to pull back spending in 2023 and 70% said inflation would mean they’d be spending less during the rest of the year.
Shoppers plan to spend less in 2023 — except for groceries
In fact, consumers said they expected to spend less in every retail vertical save one — grocery. Faced with rising food costs, 61% of respondents said they expected to be spending more on groceries this year compared to last year.
While consumers were keeping a close eye on their spending in August, online merchants were warily watching fraud trends, which continue to move in a threatening direction. Fraud pressure — a measure of the number of orders deemed very risky by Signifyd’s machine-learning models — was up 57% in August over a year ago. The beauty and cosmetics vertical was particularly vulnerable, seeing a 253% year over year increase, according to Signifyd data.
ATO and bot attacks are on the rise
Two trendy and sometimes related types of attacks also continued to be on the rise. Automated fraud attacks, launched with the aid of bots, increased 228% year over year, according to Signifyd data. The rise is establishing an era of AI vs. AI in ecommerce. As fraud protection providers innovate with solutions driven by artificial intelligence, criminal fraud rings turn to their own AI in an attempt to one-up the detection strategies anti-fraud companies deploy. Signifyd CEO Raj Ramanand talks about a common example in the video below.
The second disconcerting trend is the continued increase in account takeover attempts, which rose 202% last month over August 2022. Fraud rings rely on bots to move against consumers’ accounts at scale — either by using automated phishing schemes or by testing stolen usernames and passwords across thousands of sites in rapid succession.
Uncertain economic times could be fueling a consumer abuse boom
Meanwhile, a small percentage of rightful credit card holders continued to cause retailers trouble in August. Signifyd’s consumer abuse index was up 25% over a year ago. Signifyd’s consumer abuse index charts the rise and fall of policy abuse — false claims that a package never arrived or arrived in damaged or less-than-satisfactory condition, for instance. The number is based on the percentage of chargebacks fought by Signifyd and won over time. Signifyd assumes winnable chargebacks are highly likely to be true consumer abuse.
Curious about how ecommerce will perform this holiday season? Check out Signifyd’s Holiday Season Pulse Tracker, currently tracking predictions for holiday sales by vertical.


